Historical DOM Heatmaps
Time-series order book depth and liquidity, replayed so you can see where size actually sat — not just where price moved.
MAFIC is a native desktop charting engine that renders order flow, depth, and execution the way it actually happens — price level by price level.
Connects directly to
A native, proprietary desktop application built in Rust. No browser tab, no server round-trip — MAFIC streams directly from exchange REST APIs and WebSockets to your screen.
Time-series order book depth and liquidity, replayed so you can see where size actually sat — not just where price moved.
Volume cluster analysis, delta imbalance, and naked point-of-control studies at the price level, not the candle.
Real-time L2 order book streaming alongside tick-level execution tracking, side by side.
inside the terminal
A look at the surfaces you'll actually use — gamma exposure, volume profile, range charts, and a scripting console for your own logic.
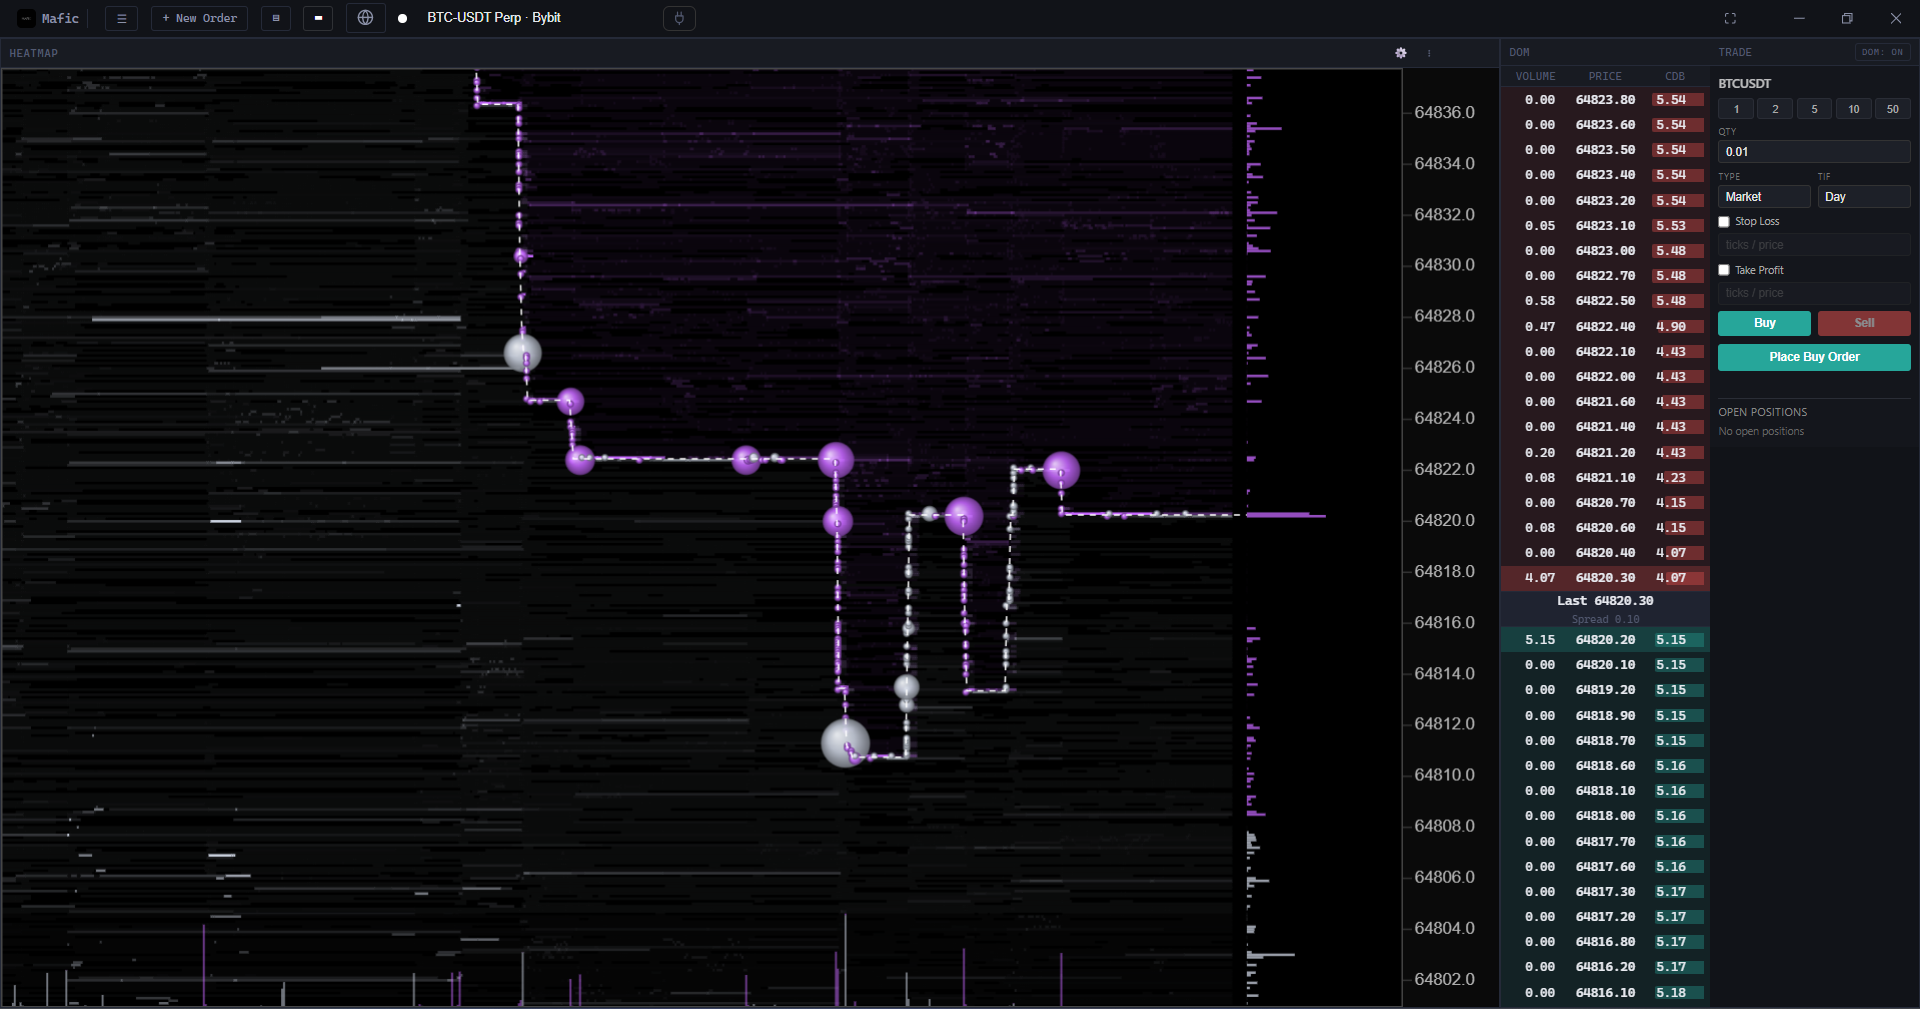
A live liquidity heatmap tracing resting size and absorption across price levels, paired with the DOM and a one-click trade ticket.
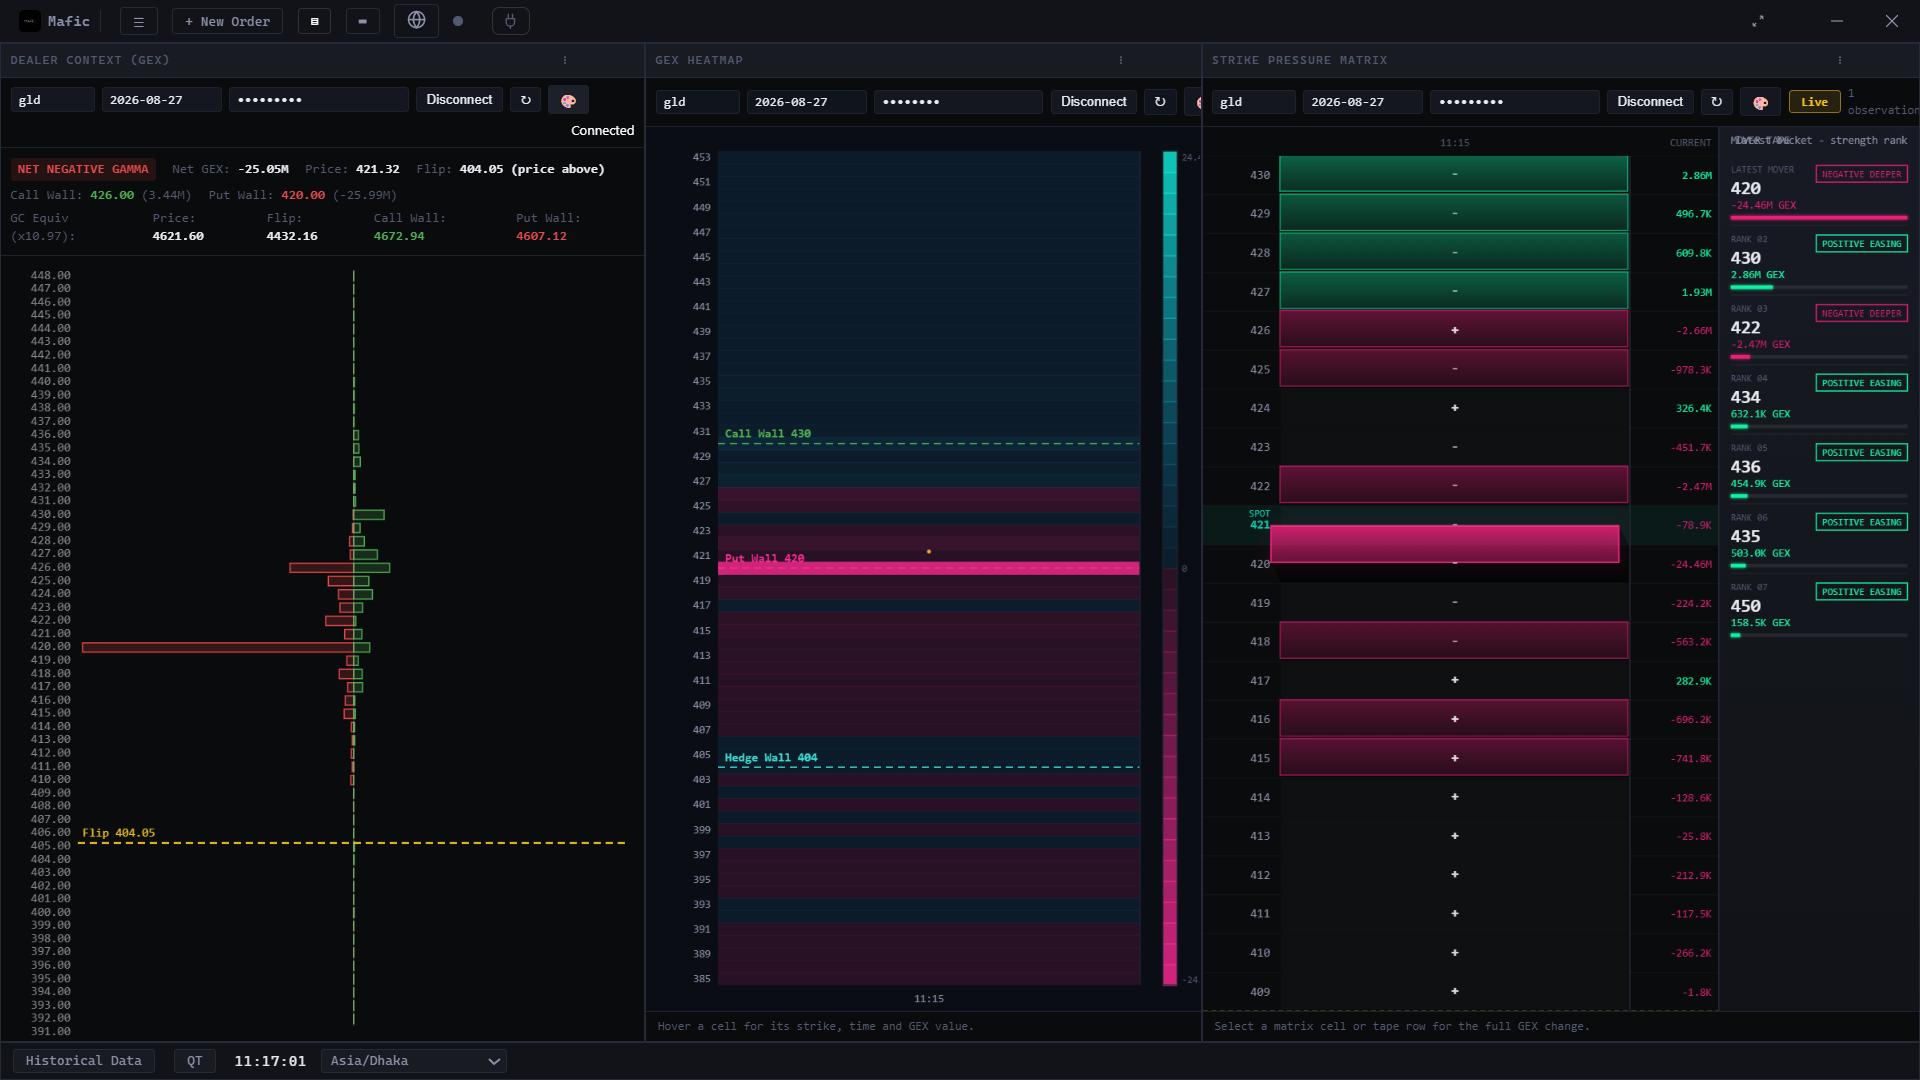
GEX heatmap, strike pressure matrix, and live dealer context — call walls, put walls, and the gamma flip line, all synced to one instrument.
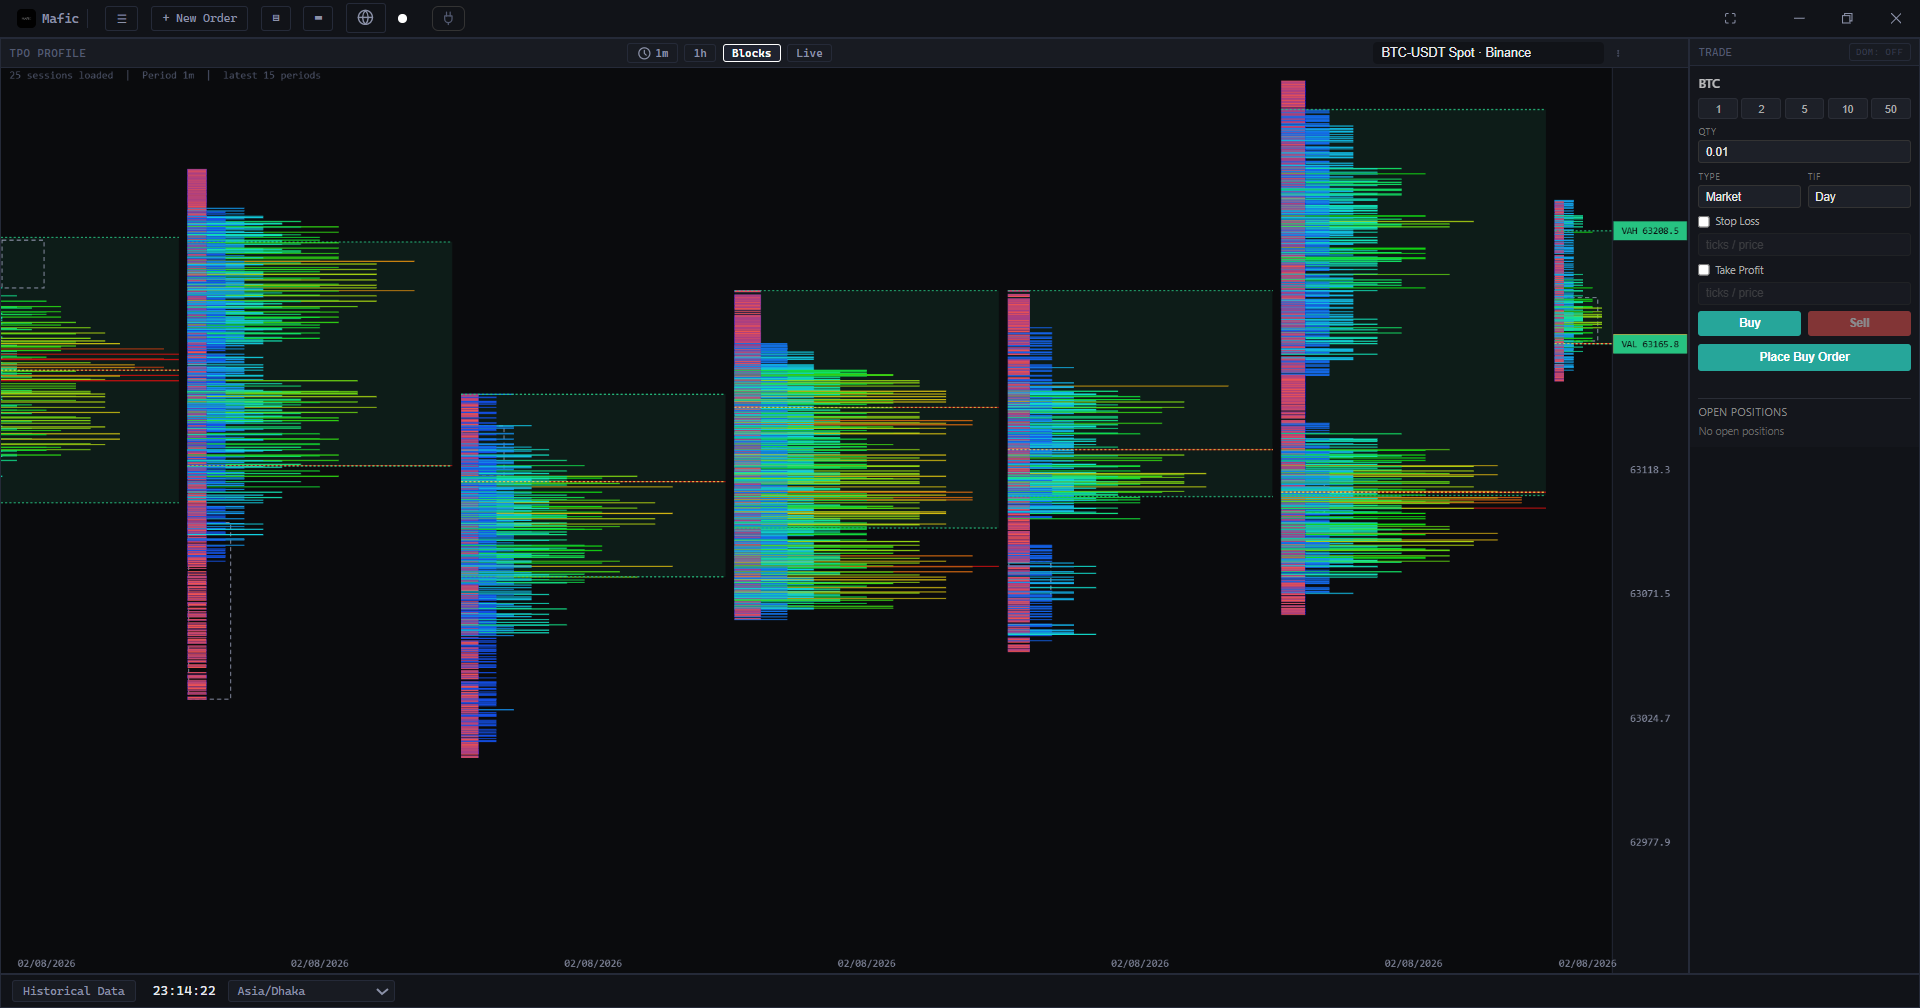
Session-by-session time-price-opportunity blocks with value area high/low, plus a trade ticket that stays on screen.
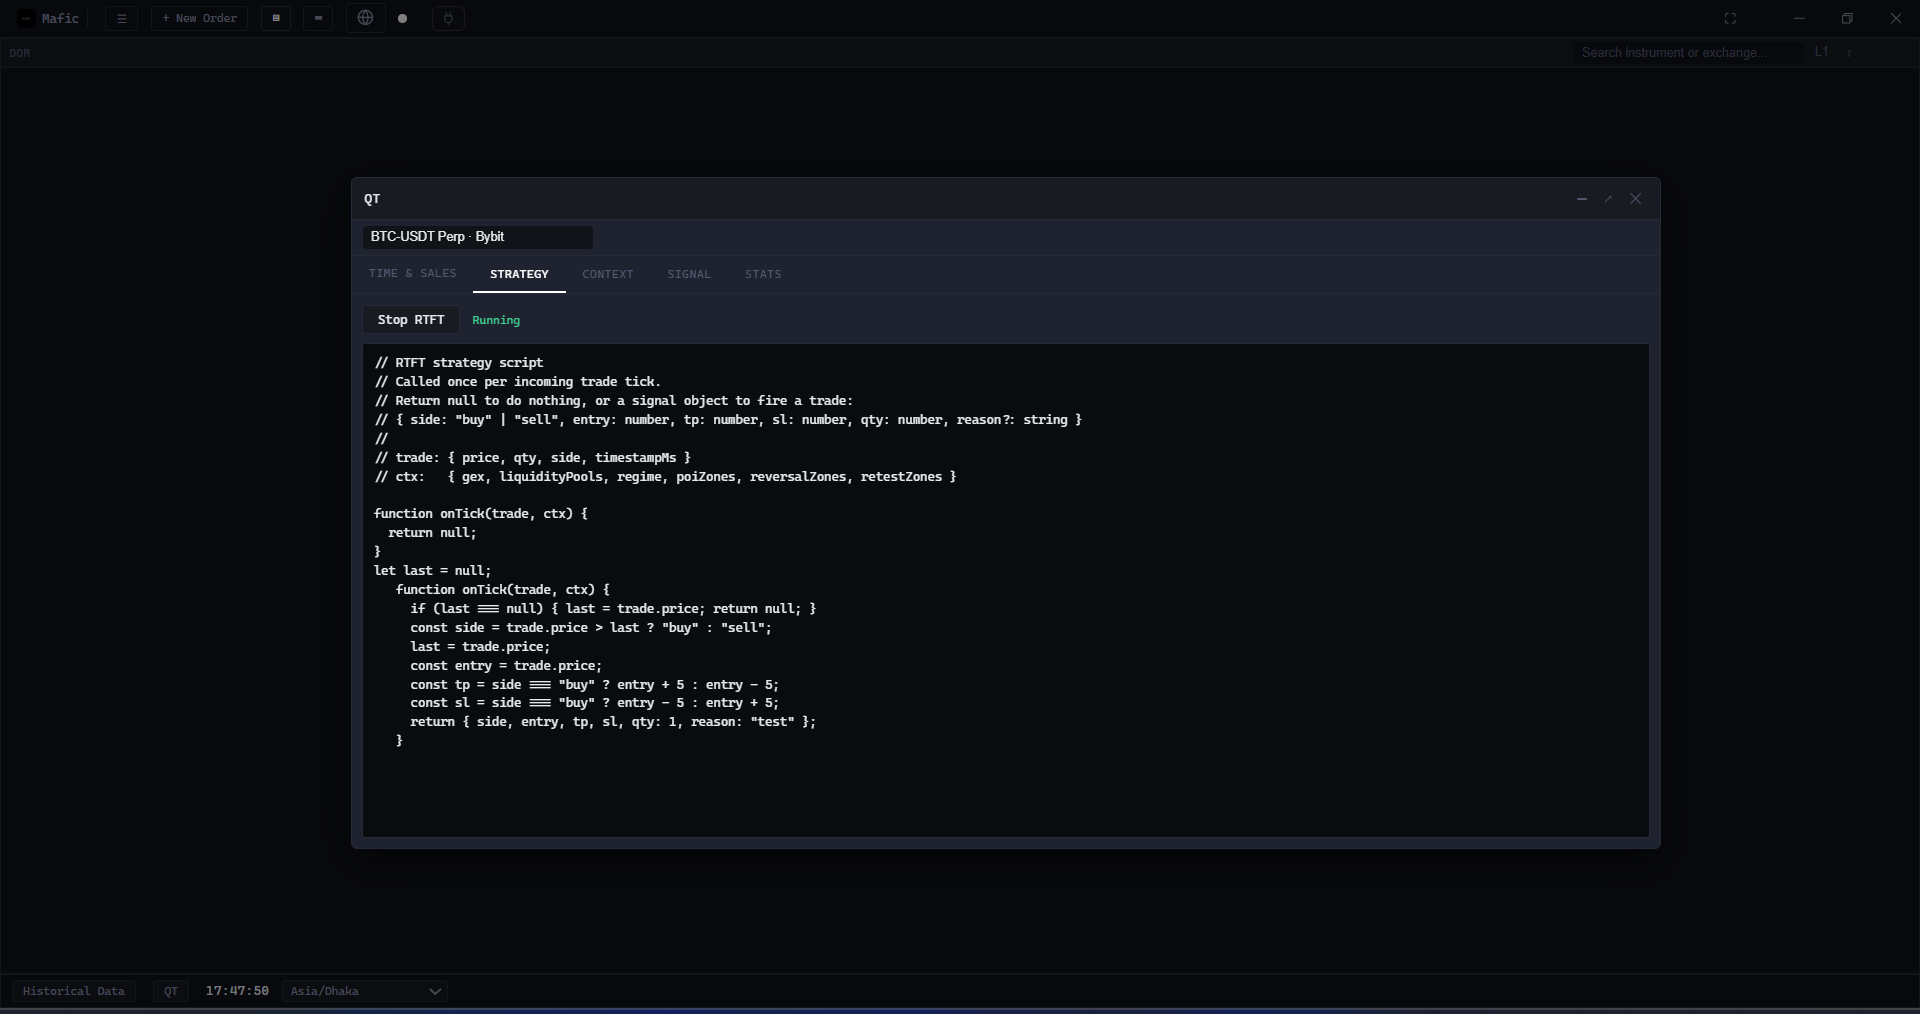
Write and run tick-driven strategies directly in TypeScript — full access to trade ticks, GEX, liquidity pools, and detected zones.
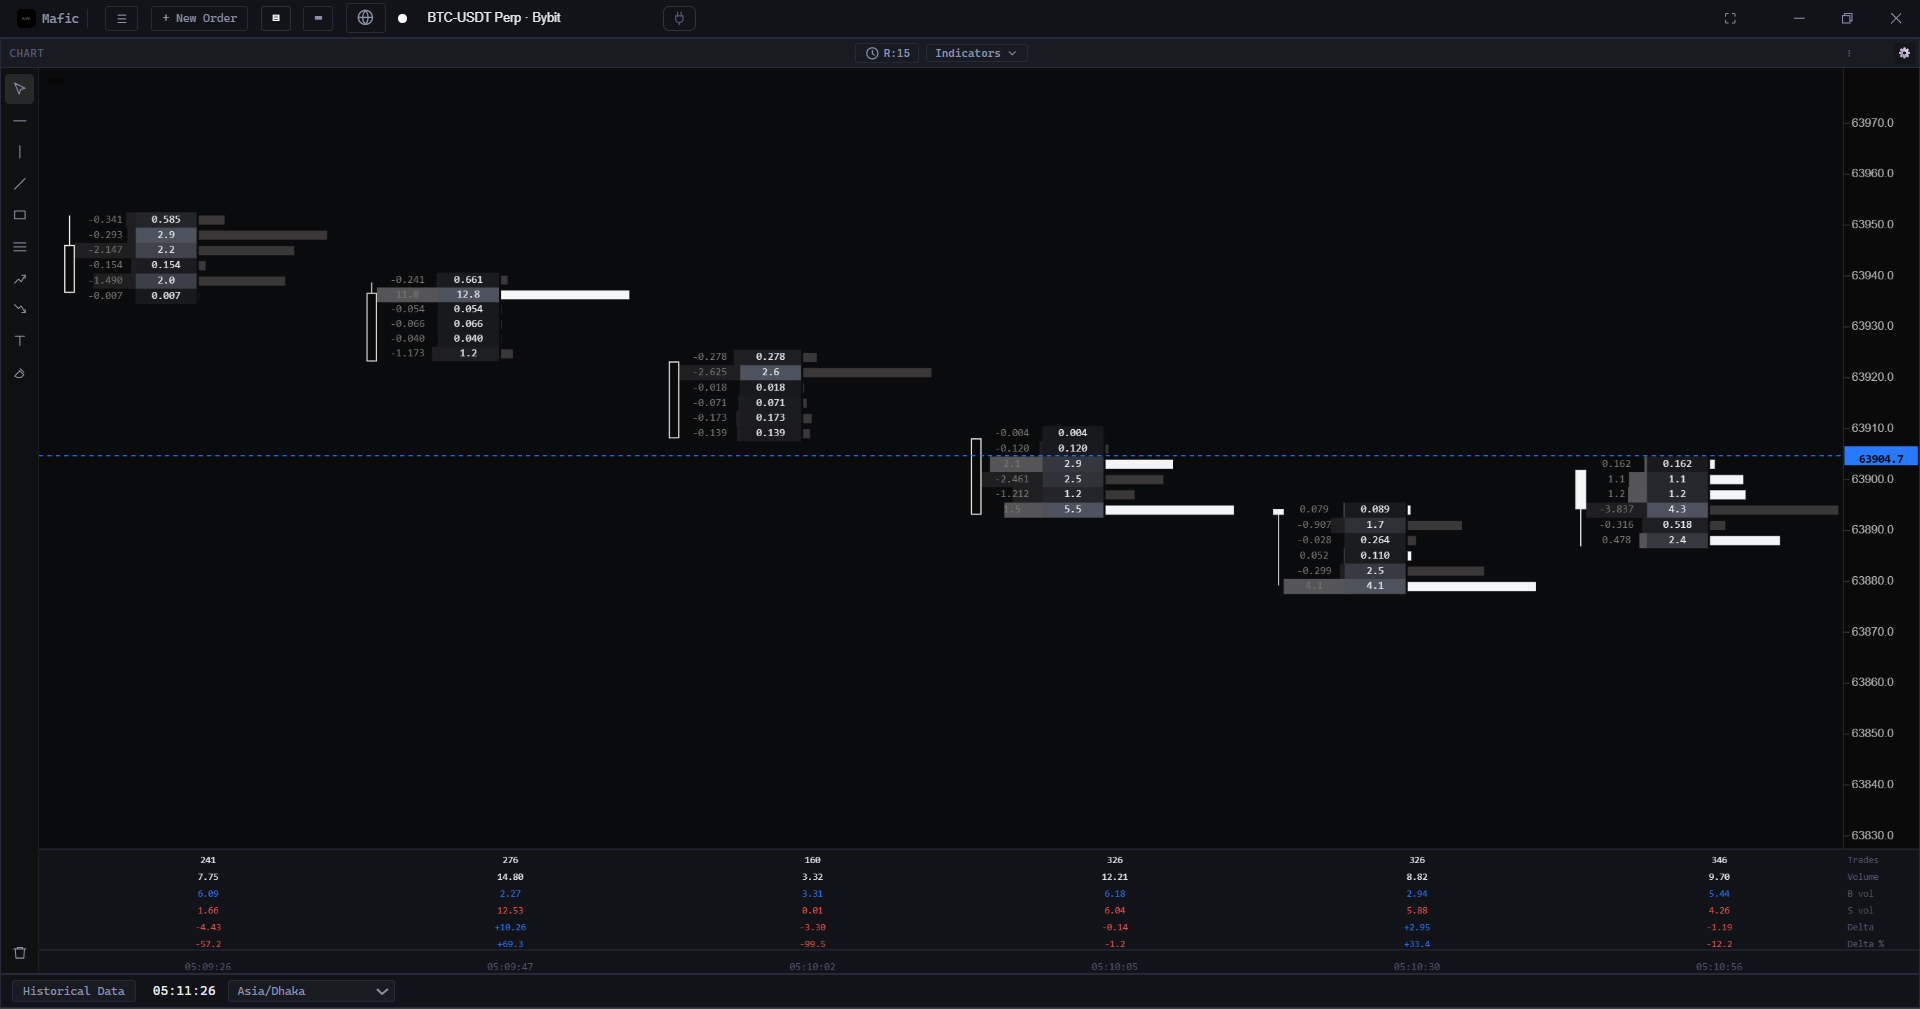
Delta and volume broken out per range bar, with a running trades / volume / delta summary underneath.
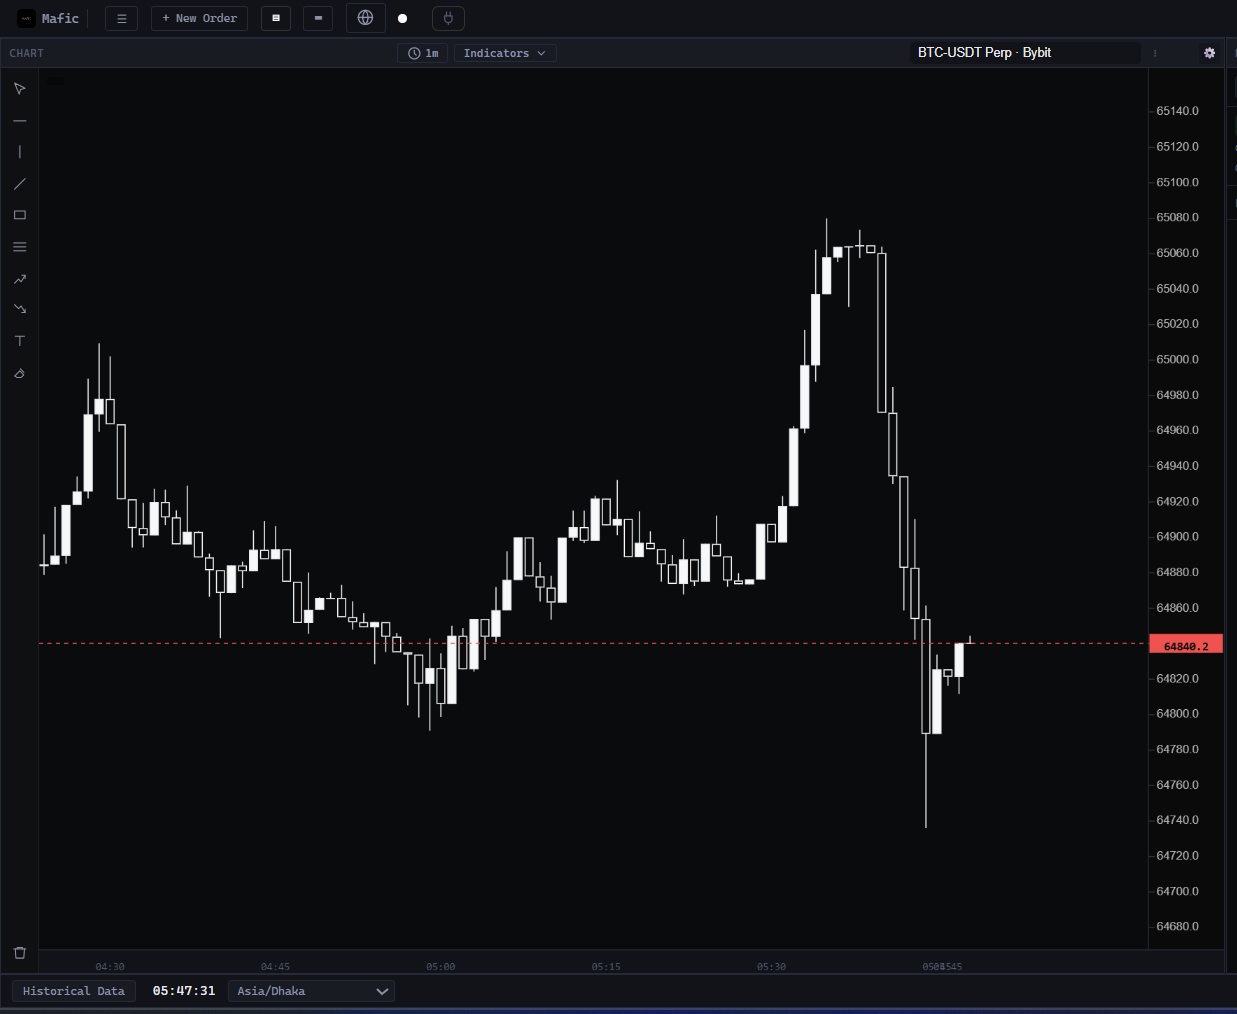
A clean, standard candlestick view when you just need price — no clutter, same low-latency feed underneath.
the layer underneath
Order flow is only half the job. FYI is MAFIC's analytics backend — it tracks what your reads actually turned into.
PnL progression, Sharpe ratio, max drawdown, and execution efficiency — logged automatically as you trade.
A live audit of strategy output, risk parameters, and historical trade logs, so drift gets caught early.
The real number underneath the charts: net returns and operational edge generated by your order-flow execution.
status
Binaries aren't public yet. When MAFIC ships, it'll be distributed as a signed Windows installer via GitHub Releases.
why i built mafic
— Muhammad Mahfuj RahmanMost charting software is heavy. It eats up system resources, lags on low-end hardware, and locks cluster charts and other core order-flow indicators behind expensive paywalls.
MAFIC does not have a huge paywall — it is built to be affordable for most traders. I created MAFIC for one simple reason: speed, usability on low-end hardware, and accessibility.
I wanted a lightweight tool that runs smoothly without hogging RAM, handling real-time L2 order flow data efficiently so you can see live market liquidity and volume absorption as it happens without your machine slowing down or breaking your bank.
Developer and Designer of MAFIC FYI
Based in Bangladesh, Muhammad Mahfuj Rahman is a law student at the University of London International Programme, having completed his Certificate of Higher Education in Common Law with an eye toward completing his LLB in 2028 and the UK Bar (BTC) in 2029. In 2026 at age 19, driven by a need for lightweight, accessible order-flow tooling, he began designing and building MAFIC — an advanced trading platform engineered to integrate with Futures data feeds, crypto exchanges, and CFD feed via MT5.
Passionate about market mechanics, quantitative analysis, and order-flow execution, Mahfuj bridges the gap between systems engineering and analytical rigor. His long-term professional trajectory spans commercial law, advocacy at the Bar, and building low-latency fintech enterprise tools and later other genre of software as well.